Using the Sensor Data
Dashboards with Grafana
A Dashboard displays the collected sensor data in a graphical user interface (GUI). They are used to monitor the current and past state of a technical system. The data are repesented by widgets like graphs, bar-charts, gauges and heat-maps. An easy to use and powerful application is Grafana, https://grafana.com.
Install and start a standard grafana container:
docker pull grafana/grafana
docker run -d -p 3000:3000 grafana/grafana
Open the URL http://172.17.0.1:3000 in the Web-Browser (usually the docker container runs on this address). Follow the instructions to set a new password, initial login is done with user: admin, password: admin.
Setup a Data Source
At first Configure the MySQL-DB used by rsensor as data source in grafana. After all parameters are entered, press “Save and Test”.
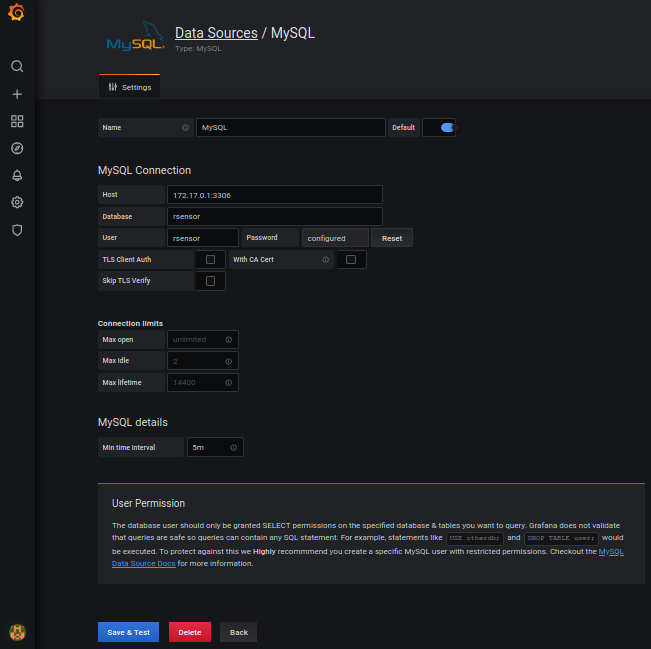
Configure dialog of the data source
Setup a Dashboard with a Panel
If the test was succesful, the next step is to configure a dashboard. Select “Create Dashboard” and “Add Panel”.
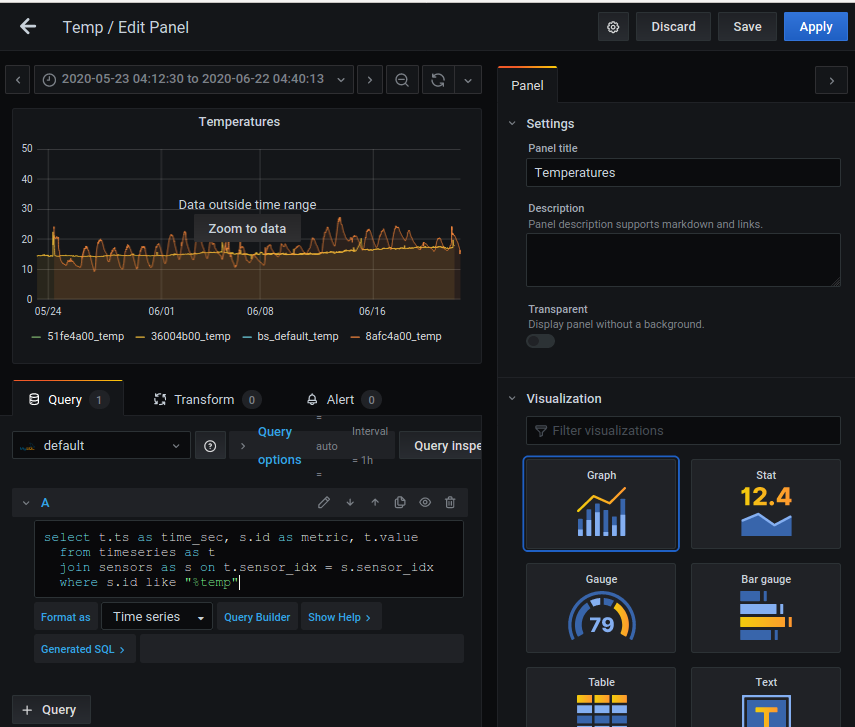
Configure dialog of a panel
In the “Query” tab press “Edit SQL” and enter the following query:
select t.ts as time_sec,
       s.id as metric,
       t.value
  from timeseries as t
  join sensors as s on t.sensor_idx = s.sensor_idx
  where s.id like "%temp"
Use and fine tune the Dashboard
Finally press “Apply” and watch the result.
By entering the “Edit” submenue, the dashboard can be further optimized and fine tuned.
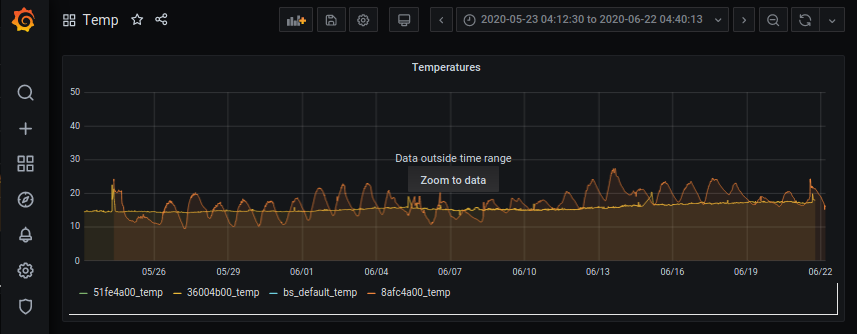
Dashboard from the above example
Data Analysis with JupyterLab
… coming soon